

The virtual machines of Java, Python, and other interpreted languages perform garbage collection, profiling, and optimizing code themselves, including compiling individual chunks.
However, sometimes they don’t work fast enough, but what can you do about it? – It turns out that virtual machines have settings that allow you to select and configure the garbage collector and other components. For example, this article will walk you through the JVM optimization process step by step. The article describes a project that was developed for a powerful computer, and then (after optimization) was successfully launched on a very weak hardware. This suggests that often by setting up a virtual machine, one can significantly (several times) save on infrastructure. Also, the JVM tuning process is described very well there.
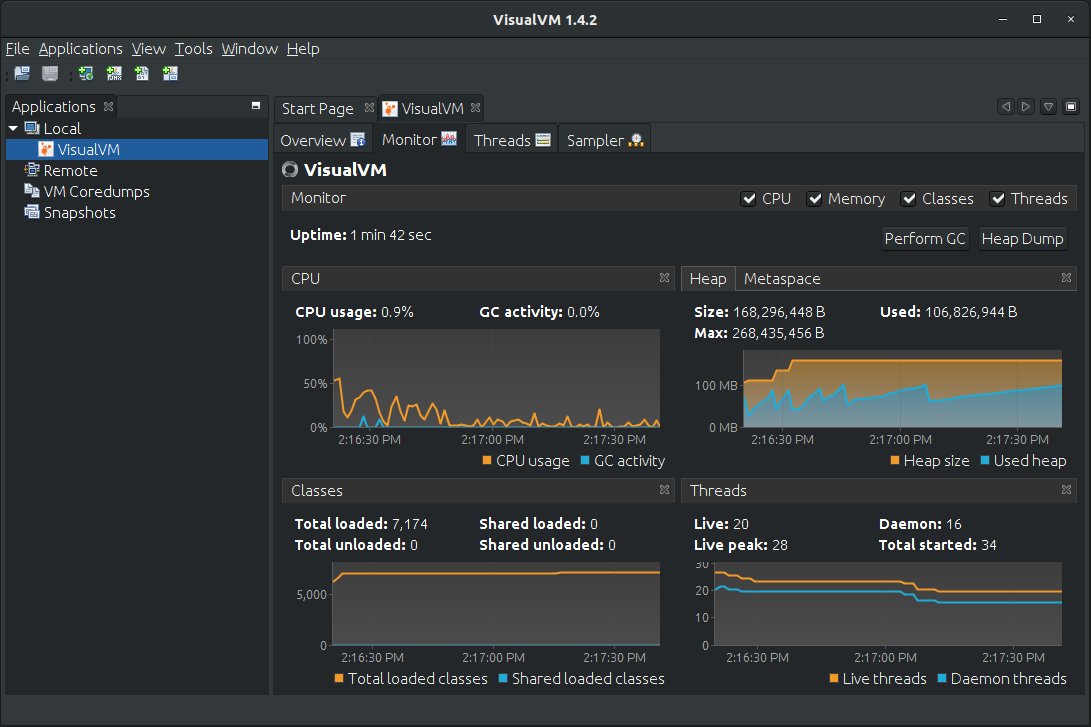
We will talk about the internal structure of virtual machines in the following articles, and now we will consider the VisualVM tool, which allows you to “look into the JVM”.
To use these settings correctly, you need to:
know how the virtual machine works inside;
be able to look at the resource usage of a virtual machine.